
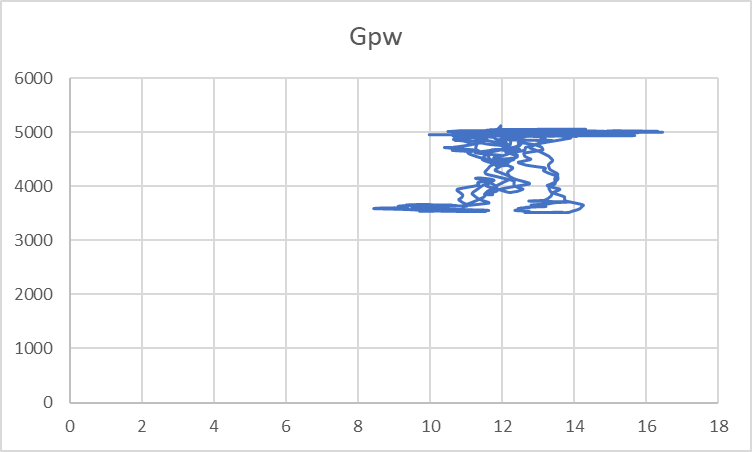
why grapgh between ‘Wind1VelX’ along x axis and ‘RtAeroFxh’ ,Gen pwr(‘GenPwr’) is like this in above figure but the paer you shared is increasing nonlinear way then becomes linear in test 18 for onshore wind turbine
,
although in reference paper rated wind speed is 25 m/s but in my case is 12.1m/s but still do not know what reason
Dear @Muhammad.Irfan,
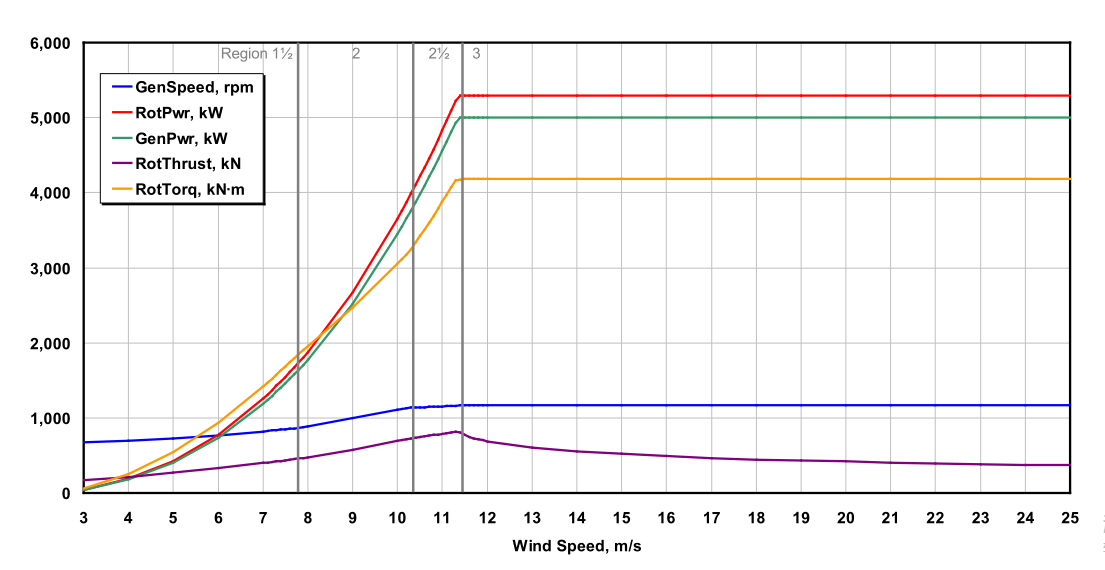
The figure from the NREL 5-MW specifications report is for steady state conditions; your plots seem to show time series. Due to the dynamics of the system, time series can have much more variability than steady state values.
The rated wind speed of the NREL 5-MW baseline wind turbine is 11.4 m/s as indicated in its documentation.
Best regards,
All right , noted thanks , i will check

What do you think for test 18 WITH ROTOR RATED SPEED 12.1 Tis aerodynamic load result is normal or having some issie with it ?

TO achieve this frequency what masses are considered at top of the tower ? are there considered all masses such as hum mass , rotor mass , nacelle mass , and all three blade masses ? because there is difference in my results and fast results , can you also make clear that what beam theory they considered for tower to take as beam for anaysis is Euller bernoulli beam or timoshenko beam theory ?
Dear @Muhammad.Irfan,
Without knowing anything about your model set-up other than that you are operating near rated rotor speed, it is hard to say, but certainly the mean value of RtAeroFxh from your plot is what I expect it to be.
The natural frequencies from Table 9-1 of the NREL 5-MW baseoline wind turbine specifications report are full-system natural frequencies, including the full mass and inertias of the rotor-nacelle assembly. In this table, the FAST results use Euler-Bernoulli beam theory and the ADAMS results use Timoshenko beam theory, and the results are very similar.
Best regards,

hello Mr Jason , This force (
RtAeroFxh ) is for one degree of freedom becuase it comes out in one column as ouput but on other hand tower has different sections as can see in picture below
I think there shoulb be force at each section of the tower so how we can get it ?
Dear @Muhammad.Irfan,
AeroDyn outputs RtAeroFxh, etc. are the total aerodynamic loads applied to the rotor, not the tower. You can output the aerodynamic loads at each node along the tower via AeroDyn outputs TwN1Fdx, etc. Select which tower nodes that you want outputs from via NTwOuts and TwOutNd and add the associated output names to the OutList in AeroDyn. See the documentation here: 4.2.1.3. Input Files — OpenFAST v3.5.2 documentation.
Best regards,
all right thanks . let me check


Dear @Muhammad.Irfan,
Yes, those AeroDyn outputs TwN1Fdx are the the outputs I was referring to. In your case, outputs TwN2Fdx through TwN9Fdx will be invalid because you’ve only defined NTwOuts = 1. If you want 9 tower node outputs, set NTwOuts = 9 and select which 9 of the 12 total you want in the TwOutNd list.
Best regards,

thanks a lot , noted
9 NTwOuts - Number of tower node outputs [0 - 9] (-) i changed to 9 but program shows aborting
When you set NTwOuts = 9, you must enter 9 node numbers in TwOutNd; currently, you’ve only entered 5. The node numbers should be values in the range from 1 to NumTwrNds, which you have set to 12. So, select which of 12 nodes you want to output (you must skip 3 nodes because NTwOuts can be at most 9.
Best regards,
thanks tower has total 11 section but can get only 9 nodes , why?\
Dear @Muhammad.Irfan,
I agree that your tower model has 11 sections (elements) bounded by 12 nodes. For practical reasons, the number of output nodes was limited to 9 in AeroDyn (otherwise, outputs such as TwN1Fdx would require 2 digits and there would be an addition 90 outputs possible, increasing the complexity of the implementation). It is typically sufficient to understand the aerodynamic loading of the tower by only looking at 9 of the nodes, as long as these 9 nodes are distributed roughly evenly along the tower.
Best regards,
all right , thanks , noted it